ExplainerTrade & Sanctions
What Russia exports: energy, metals, grain and fertilizer
Russia exports a broad range of commodities, but product definitions, changing prices and restricted data make the headline totals easy to misread.
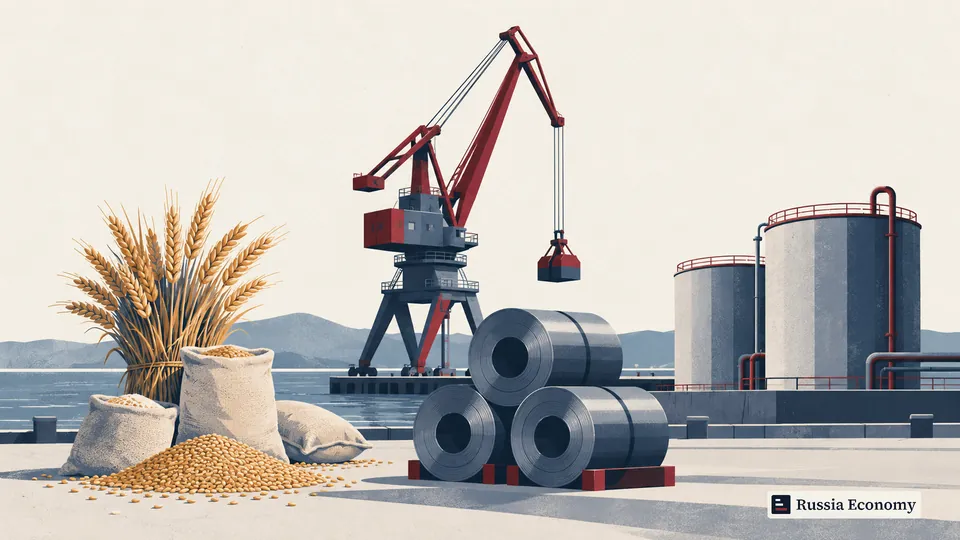
Russia exports primarily commodities and products made from them: oil and gas, coal, metals, grain and fertilizer are central to the mix. Machinery, wood products and other goods also contribute. Export earnings depend on the quantities shipped, the prices received and the cost of reaching customers, so a larger dollar total does not necessarily mean more physical production.
The Federal Customs Service reported goods exports of $304.2 billion for January to August 2026 in its October 12 release. Mineral products represented 56.1 percent of those exports. That broad customs group is not synonymous with oil and gas, and the partial-year figures should not be presented as a completed 2026 result.
What the product totals include
The latest complete calendar-year breakdown gives a fuller view of the export basket. Federal Customs Service figures reported by Interfax on February 10, 2026 put total goods exports at $418.3 billion in 2025. The following selected categories account for most of that value:
| Product group | 2025 export value, USD billion |
|---|---|
| Mineral products | 225.3 |
| Metals and articles made from them | 74.7 |
| Food and agricultural raw materials | 40.9 |
| Chemical products | 33.6 |
| Machinery, equipment, vehicles and other goods | 29.6 |
| Wood, pulp and paper products | 10.6 |
Source: Federal Customs Service figures reported by Interfax on February 10, 2026; checked October 17, 2026. Customs values in current US dollars; selected groups, not an exhaustive breakdown.
Mineral products accounted for 53.9 percent of 2025 goods exports, according to the same customs release. The category includes more than hydrocarbons: treating the entire amount as oil-and-gas revenue overstates what the label proves. Chemical products likewise include much more than fertilizer, while food and agricultural raw materials cover more than wheat.
These classifications also differ from political or promotional labels such as nonresource exports. A processed metal or chemical can involve substantial industrial activity while still depending heavily on resource inputs and global commodity prices. Whether it falls into a particular nonresource category depends on the methodology being used.
Gross exports are not domestic value added. An exported product can contain imported inputs, and its selling price includes the value of materials used earlier in production. Export totals therefore cannot be added directly to wages or corporate profits as if they were separate measures of national income.
Energy has several different export models
Oil can be sold as crude or processed into petroleum products. Those businesses have different customers, infrastructure and margins. Refinery output depends on the ability to process crude, while crude export capacity depends on pipelines, ports and shipping. A change in one stream need not indicate the same change in the other.
Natural gas presents another distinction. Pipeline exports are tied to specific networks and customers. Redirecting a pipeline's former sales is not equivalent to redirecting a tanker: new connections require investment, capacity and agreements. Liquefied natural gas can reach a wider range of ports, but production and shipping still depend on specialized infrastructure. The US Energy Information Administration's Russia country analysis describes these separate systems.
Coal adds a different transport problem. Because freight absorbs part of the delivered value, rail capacity, distance and port access can be decisive to whether a sale is attractive. Higher export volume can coexist with a squeeze on the producer's margin if transport costs rise or the price received falls.
The role of oil and gas in the economy also extends beyond export receipts. Taxes, domestic energy supply, investment and the exchange rate connect the sector to the wider economy. Customs export value is consequently an important indicator, but it is not the same thing as the federal government's oil-and-gas revenue.
Metals, grain and fertilizer follow their own cycles
Russia's mineral base supports steelmaking and nonferrous metals as well as extraction. The US Geological Survey identifies the country as a major producer across several metals and fertilizer minerals. Production rank, however, does not establish export rank: some output is consumed domestically, processed further or held in stocks.
A metal-export total can move because the world price changes, even if tonnage is stable. It can also change with the mix of products sold. More high-value metal and less bulk material can raise the aggregate dollar figure without a comparable increase in total physical weight. A broad customs category cannot resolve those effects by itself.
Grain requires attention to harvests and marketing years. FAO's Russia country brief organizes cereal assessments around agricultural seasons as well as calendar-year information. A forecast for a crop marketing year is not an observed customs total for January to December. Harvest size, carryover stocks, domestic use and export conditions all affect how much grain is available for foreign buyers.
Fertilizer combines mineral resources and industrial processing. Nitrogen production depends on energy and feedstock costs, while potash and phosphate products depend on different resource and production chains. The entire chemical-export category should therefore never be relabeled fertilizer. Product-specific volumes and prices are needed to assess that industry's performance.
These sectors diversify Russia's sources of export earnings, but they remain exposed to global demand and transport conditions. More revenue from metals or chemicals can offset some weakness elsewhere without demonstrating that the economy has become less sensitive to commodity markets.
How destinations changed after 2022
Russia's full-scale invasion of Ukraine, launched in February 2022, was followed by major changes in trade routes. EU sanctions included a crude-oil price-cap mechanism applicable from December 5, 2022, according to the Council of the EU. The US Energy Information Administration attributes the shift in Russian oil destinations largely to sanctions related to the invasion. Its August 2025 analysis found that Asia and Oceania received 81 percent of Russian crude-oil and condensate exports in 2024, compared with 41 percent in 2020. China and India accounted for most of the later Asian flow.
Those percentages describe crude oil and condensate. They do not describe all Russian exports, and they should not be attached to natural gas or fertilizer. Different products face different customers, transport options and restrictions. The Russia and China trade relationship is one major part of the wider adjustment.
Geographic labels need care too. The customs service reported that Asia accounted for 75.5 percent of total Russian goods trade in January to August 2026. That is the share of exports plus imports, not the export share alone. A strong Asian presence in imported machinery can influence the combined measure as well as Russian commodity sales.
Europe has not disappeared from every product market. Eurostat's March 25, 2026 release still recorded Russian supplies among EU liquefied-natural-gas imports in 2025. Whether a transaction is permitted depends on the jurisdiction, product, parties and rules in force. Broad geographic totals cannot establish whether particular shipments complied with applicable restrictions.
Changing destinations can preserve sales while altering costs. Longer journeys, additional intermediaries and payment arrangements may change the seller's net return. Assessing sanctions and the Russian economy therefore requires evidence about prices and costs alongside evidence that cargoes continued moving.
Why customs and balance-of-payments figures differ
The Bank of Russia's balance-of-payments estimate, updated on October 15, 2026, put goods exports at $312.4 billion for January to August 2026. That exceeds the customs figure for the same period. The difference is not, by itself, a contradiction.
The central bank's methodology records changes in ownership between residents and nonresidents. It adjusts customs information and includes transactions that customs does not observe, such as certain goods sold without crossing Russia's border. It also applies balance-of-payments valuation and classification rules. The monthly estimate is preliminary and subject to revision.
The goods trade balance is exports minus imports under the selected methodology. The current account additionally includes services and income flows. Neither is a direct measure of how much export currency was immediately sold for rubles. The relationship between the ruble and export receipts depends on payment timing and firms' financial decisions as well.
What restricted data prevent readers from concluding
Interfax reported that the customs service suspended publication of import and export statistics in April 2022. Aggregate value reporting resumed in March 2023, according to Interfax's account of the renewed releases. The existence of current headline totals does not mean the former level of product and partner detail is fully available.
Partner-country statistics, shipping information and institutional estimates can help fill gaps, but they have different coverage and revision practices. Reexports, delivery timing and differences between the recorded destination and final buyer can complicate comparisons. Independent estimates should retain their labels instead of being presented as undisclosed official data.
The sound conclusion is specific: Russia remains a large commodity exporter whose destinations and transaction costs have changed. To judge the economic result, separate physical volume from current-dollar value, identify the statistical system, and compare like periods. Without those distinctions, a clear-looking export number can answer the wrong question.
Sources
- Federal Customs Service, Foreign trade results for January to August 2026, official channel announcement (2026-10-12)
- Interfax, Russian merchandise trade surplus rose to 102.9 billion dollars in January to August 2026 (2026-10-12)
- Interfax, citing the Federal Customs Service, Russia exports and imports by major commodity group in 2025 (2026-02-10)
- Bank of Russia, Balance of payments estimate of the Russian Federation: August 2026 (2026-10-15)
- Bank of Russia, Methodological commentary on the balance of payments of the Russian Federation
- Bank of Russia, Methodological commentary on the balance of payments estimate
- US Energy Information Administration, Russia's oil exports have decreased modestly since 2022, shifting toward Asia (2025-08-07)
- US Energy Information Administration, Country analysis brief: Russia, 2025
- US Geological Survey, Russia mineral-industry profile
- Food and Agriculture Organization of the United Nations, GIEWS country brief: Russian Federation
- Interfax, Russia might enshrine government right to stop publication of statistics in law
- Interfax, Central Bank of Russia resumes monthly merchandise trade figures under balance of payments methodology (2023-03-14)
- Eurostat, EU imports of liquefied natural gas by main partner in 2025 (2026-03-25)
- Council of the European Union, Russian oil: EU agrees on level of price cap (2022-12-03)
Figures come from the listed sources for the dates and periods stated and may be revised.